 |
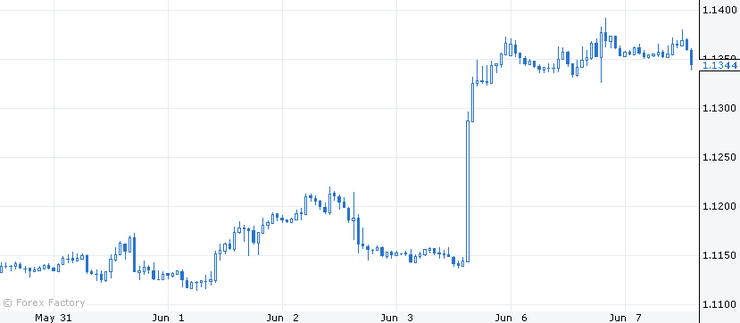
| EUR/USD 1-hour chart, source forexfactory.com |
After the plunge due to the Brexit referendum, currency pair EUR/USD raises its bottoms as though it prepares rebound. But it seems to form a wedge. It is needed to be watch the market more carefully.
As I have said, the economic situation precedes the technical analysis. The realized Brexit makes the market unstable and uncertain. Though Europe finished Tuesday with bullish market, it doesn't confirm that the confusion diminished. And the wedge pattern in the chart shows the uncertainty. The price can rise and go down. In the uncertain market circumstance and economic situation, the unstable wedge pattern, what do we do?
Someone gets great profit in the confusion. Hedge trader, George Soros is known to get some hundred-million-dollar profit betting short position in Deutche Bank. He has conquered Bank of England betting short position against British Pound. But most of us is not excellant trader. Most of us doesn't have the great insight on the market as him. We trade by the probability and the risk management. The legendary traders, turtles didn't have the insight but traded with boring rules and risk magement such as loss cut. Ordinary traders should follow the oridnary rules, I think. Just watch the market when the uncertain market.
It is meaningless the up-or-down trend is forecasted, because the shock of Brexit doesn't disappear yet. Because the fundamental analysis precedes the technical analysis.
http://cafe.naver.com/gjallarhorn/35


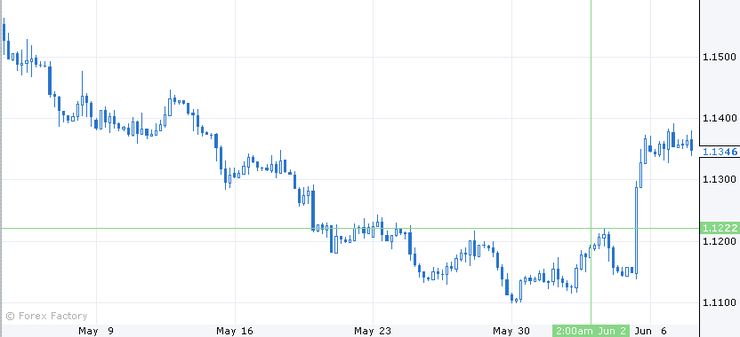

 GBP/USD 4-hour chart, source: forexfactory.com


